
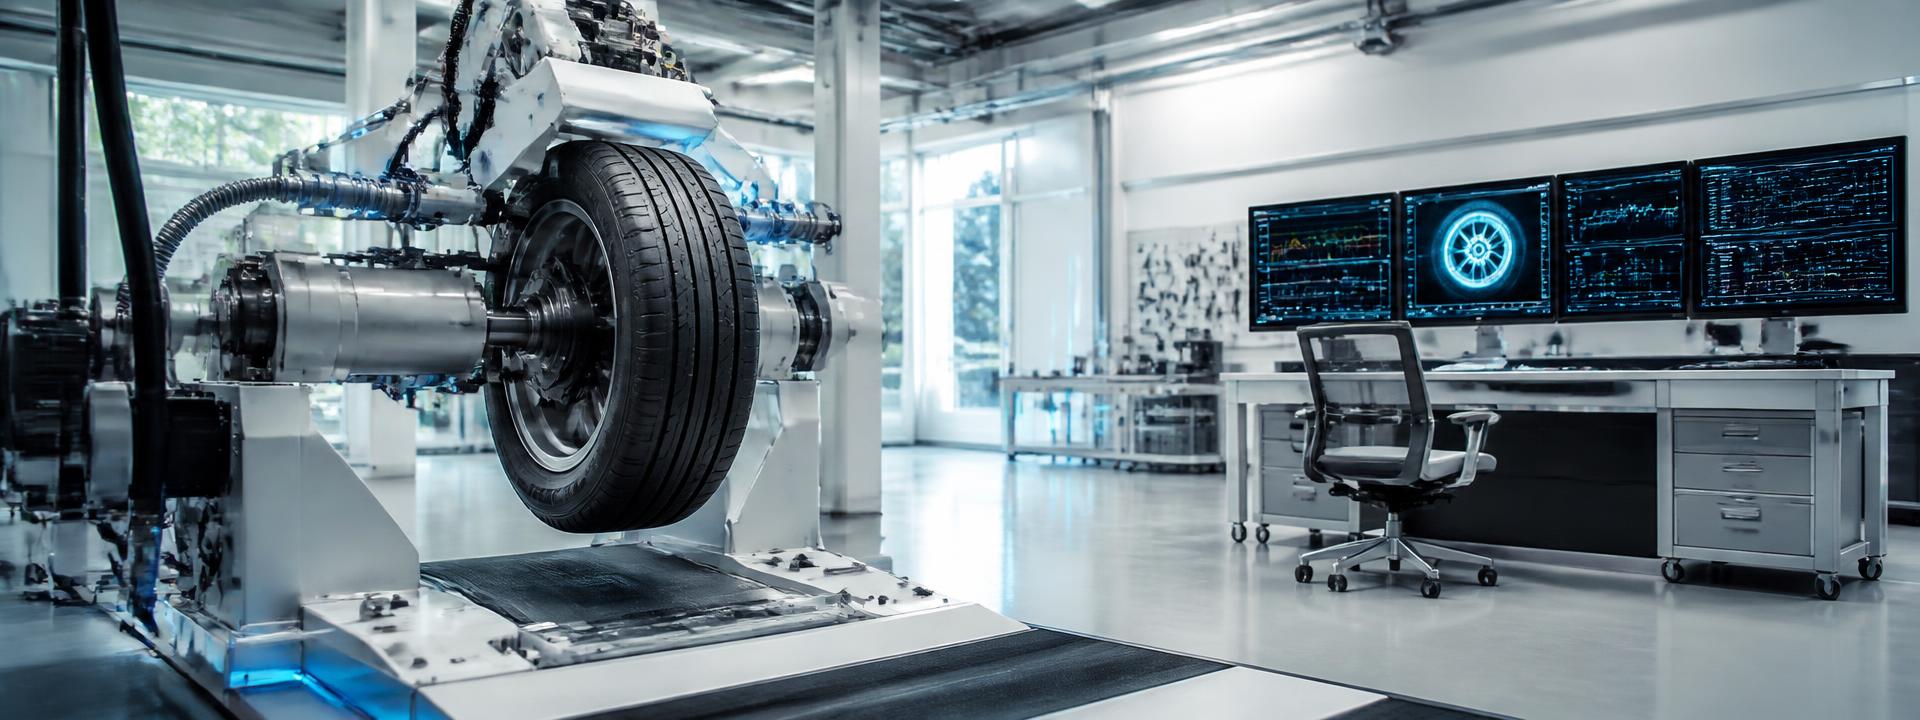
Science lab
The published evidence behind every pressure AiR applies
Manufacturer pressures are cold specifications tied to axle load. Everything on this page comes from peer-reviewed literature, reference monographs, government research, international standards and official statistics - not from AiR's simulation. Every claim is linked to its source.
Cited sources
40
Peer-reviewed papers, monographs, agency reports, standards and official statistics.
Themes
8
Fundamentals, wear, energy, safety, vehicle-road interaction, emissions, standards, statistics.
Simulated figures
0
Nothing on this page is generated by the AiR simulation engine.
01 - Fundamentals
What inflation pressure actually does
Air carries the load, not the rubber
A pneumatic tyre is an inflated toroidal membrane. Load capacity is a function of inflation pressure and deflection; the tread contributes grip and wear resistance, not load support. Remove pressure and the structure carries load in a way it was never designed to.1981,2006
Specifications are cold specifications
Placard and handbook pressures are defined at ambient, unheated conditions. Absolute pressure follows the gas law with temperature, giving roughly 1 psi per 10°F of tyre temperature - which is why a hot tyre set to the placard value is soft once it cools.2006,1981
TPMS is an alarm, not a control
European type approval expects a warning in the region of 20% below specification. That threshold exists to catch punctures, and sits far beyond the error at which wear and energy penalties are already being paid.2016
Cold-pressure equivalence
Manufacturer pressures are cold specifications. A warm tyre reads high, so a hot-measured tyre set to the placard value is actually under-inflated once it cools. Gas-law behaviour on absolute pressure gives roughly 1 psi per 10°F.2006,1981
Cold equivalent
29.5 psi
That is 3.5 psi lower than the gauge reading. Setting to the placard value while warm leaves the tyre soft when cold.
AiR applies a measurement allowance. It never alters the approved specification.
02 - Premature wear
Why a small pressure error scraps a tyre early
Premature wear is not uniform wear happening faster. It is wear concentrated where the tyre was never designed to carry load, driven by a contact patch that has changed shape.
Contact stress across the tread
Vertical contact stress is not uniform. Below specification the crown cannot be held flat and load migrates to the shoulders; above it, load concentrates at the centre.1997,2006
Approved specification for this example is 33 psi. Shoulder-loaded. Centre of the footprint is unloading.
03 - Rolling resistance and energy
Lost pressure is lost energy on every revolution
Rolling resistance is the macroscopic expression of hysteretic loss in a deflecting tyre. It varies approximately inversely with inflation pressure, and it converts directly into fuel or charge.
Energy and wet-grip sensitivity
Rolling resistance rises approximately inversely with inflation pressure, and a 10% rolling-resistance change is worth roughly 1-2% of fuel consumption.2001,2006,2006 Hydroplaning speed scales with the square root of pressure.1963
Rolling resistance
+10.0%
Energy consumption
+1.50%
Hydroplaning onset
53 mph
Relative to the approved 33 psi specification. Hydroplaning figures are for a smooth flooded surface and are indicative of direction, not a prediction for a specific tyre.
- A 10% reduction in rolling resistance is worth roughly 1-2% of fuel consumption for a passenger car.2006
- Rolling-resistance coefficient falls as inflation pressure rises, approximately as an inverse power relationship over the normal operating range.2001,2006,2008
- Tyre pressure maintenance is treated internationally as a recognised policy instrument for fleet-wide fuel reduction.2017
- Rolling resistance is only comparable when measured under the standard method and its mandated pressure conditions.2018,2020
04 - Safety
Braking, aquaplaning and crash involvement
Every rated safety property of a tyre is rated at a specified pressure. Below it, the vehicle does not have the performance its label describes.
Hydroplaning threshold
Hydroplaning inception speed scales with the square root of inflation pressure. A soft tyre loses contact with the road at a lower speed on standing water, which is the condition most UK rutted surfaces produce in rain.1963
Handling margin
Because cornering stiffness and relaxation length move with pressure, an under-inflated axle responds later and differently to a steering input, and the front-to-rear balance shifts if only one axle is low.2012
Crash involvement
Pre-crash analysis of national crash data found vehicles with tyres 25% or more below the recommended pressure were markedly more likely to be involved in a tyre-related crash than correctly inflated vehicles.2012
05 - Vehicle-road interaction
Potholes, dynamic loading and the road itself
The tyre is the only component that touches the road, and the first that deflects when the road is broken. Pressure determines how much of a pothole impact is absorbed and how much is delivered onward into the wheel, the suspension and the pavement.
The tyre is the first suspension element
Over a pothole edge the tyre deflects before the suspension does. Correct pressure provides the deflection budget to spread that impulse over time; under-inflation exhausts it, the tyre bottoms against the rim, and the force is delivered as a near-impulse.1999,1981
06 - Emissions
Non-exhaust particulate matter
Tyre and road wear particles now dominate traffic particulate emissions. Wear rate is emission rate, so inflation accuracy is an air-quality control as well as a cost and safety one.
Now the dominant traffic PM source
As exhaust emissions have fallen, non-exhaust sources have become the leading contributor to traffic particulate matter, and heavier electrified vehicles increase wear emissions further.2020
07 - How AiR uses this
From literature to a three-minute forecourt session
References
Full bibliography
Grouped by theme. Each entry lists authors, title, venue and year, with a link to the publisher, DOI or issuing body, and a one-line note on what it establishes for AiR.
Tyre mechanics and inflation fundamentals
The Pneumatic Tire
Gent, A. N. and Walter, J. D. (eds.) (2006). US National Highway Traffic Safety Administration, DOT HS 810 561.
The reference monograph on tyre construction, inflation pressure, contact mechanics, rolling resistance and wear. Underpins every pressure relationship AiR models.
Open sourceMechanics of Pneumatic Tires
Clark, S. K. (ed.) (1981). US Department of Transportation / National Bureau of Standards Monograph 122.
Classical derivation of the inflated toroidal membrane: load capacity is a function of inflation pressure and deflection, not of the tread alone.
Open sourceTire and Vehicle Dynamics (3rd edition)
Pacejka, H. B. (2012). Butterworth-Heinemann / Elsevier.
Cornering stiffness, relaxation length and slip behaviour all shift with inflation pressure, so pressure error changes vehicle handling, not just wear.
Open sourceTheory of Ground Vehicles (4th edition)
Wong, J. Y. (2008). John Wiley & Sons.
Standard treatment of rolling resistance coefficient as a function of inflation pressure, speed and load, used for the energy model on the science page.
Open source
Wear, abrasion and premature tyre failure
Rubber Abrasion and Tire Wear
Grosch, K. A. (2008). Rubber Chemistry and Technology, 81(3), 470-505.
Abrasion rate rises steeply with frictional energy dissipated in the contact patch - the mechanism by which incorrect pressure destroys tread early.
Open sourceDetermination of Pneumatic Tyre/Pavement Interface Contact Stresses under Moving Loads
De Beer, M., Fisher, C. and Jooste, F. J. (1997). 8th International Conference on Asphalt Pavements (ISAP), Seattle.
Measured Stress-In-Motion data: under-inflation moves vertical contact stress onto the tyre shoulders, over-inflation concentrates it at the centre.
Open sourceTire Tread Wear - A Review of the Influence of Operational and Environmental Factors
Veith, A. G. (1992). Rubber Chemistry and Technology, 65(3), 601-659.
Review evidence that inflation pressure, load and duty cycle are first-order determinants of tread wear rate and wear uniformity.
Open source
Rolling resistance, fuel and range
Tires and Passenger Vehicle Fuel Economy (Special Report 286)
Transportation Research Board, National Research Council (2006). National Academies Press.
A 10% reduction in rolling resistance yields roughly a 1-2% fuel-consumption improvement; keeping tyres properly inflated is the single cheapest lever available to drivers.
Open sourceFundamentals of Rolling Resistance
Hall, D. E. and Moreland, J. C. (2001). Rubber Chemistry and Technology, 74(3), 525-539.
Rolling resistance varies approximately inversely with inflation pressure: lost pressure is lost energy on every revolution.
Open sourceRolling Resistance (chapter 12 of The Pneumatic Tire)
LaClair, T. J. (2006). US National Highway Traffic Safety Administration.
Quantifies the pressure sensitivity of rolling-resistance coefficient used in the AiR energy-penalty model.
Open sourceImproving the fuel economy of road vehicles - a policy package
International Energy Agency (2017). IEA / Global Fuel Economy Initiative.
Tyre pressure maintenance and low rolling-resistance tyres are recognised policy instruments for fleet-wide fuel reduction.
Open source
Braking, hydroplaning and crash risk
Phenomena of Pneumatic Tire Hydroplaning
Horne, W. B. and Dreher, R. C. (1963). NASA Technical Note D-2056.
The classical hydroplaning-speed relation scales with the square root of inflation pressure: a soft tyre aquaplanes at a lower speed.
Open sourceTire-Related Factors in the Pre-Crash Phase (DOT HS 811 617)
US National Highway Traffic Safety Administration (2012). NHTSA National Center for Statistics and Analysis.
Vehicles with tyres inflated 25% or more below specification were substantially more likely to be involved in a tyre-related crash than correctly inflated vehicles.
Open sourceTire Pressure Special Study: Vehicle Observation Data (DOT HS 809 317)
US National Highway Traffic Safety Administration (2001). NHTSA.
Large-scale roadside observation showing that a substantial share of passenger vehicles run at least one significantly under-inflated tyre.
Open sourceTire Pressure Maintenance - A Statistical Investigation (DOT HS 811 086)
US National Highway Traffic Safety Administration (2009). NHTSA.
Drivers do not check pressures often enough to offset natural permeation loss; periodic manual checking is an unreliable control.
Open sourceFinal Regulatory Impact Analysis, FMVSS No. 138: Tire Pressure Monitoring Systems
US National Highway Traffic Safety Administration (2005). NHTSA Office of Regulatory Analysis and Evaluation.
Government cost-benefit case for pressure monitoring, including quantified fuel, tread-life and casualty benefits of correct inflation.
Open source
Vehicle-road interaction and pavement damage
Handbook of Vehicle-Road Interaction
Cebon, D. (1999). Swets & Zeitlinger / Taylor & Francis.
Dynamic wheel loads over surface defects, and how tyre and suspension characteristics govern the peak force delivered into the pavement.
Open sourceDynamic Interaction of Heavy Vehicles with Roads and Bridges - Final Report
OECD DIVINE Programme (1998). Organisation for Economic Co-operation and Development.
International test programme linking dynamic tyre loading to accelerated pavement deterioration; softer, better-controlled tyre loading reduces road damage.
Open sourceThe AASHO Road Test, Report 5: Pavement Research (Special Report 61E)
Highway Research Board (1962). National Academy of Sciences.
Origin of the fourth-power damage law: pavement damage rises steeply with axle load, so peak dynamic loads matter far more than average ones.
Open sourceALARM Survey (Annual Local Authority Road Maintenance Survey)
Asphalt Industry Alliance (2025). Asphalt Industry Alliance, annual series.
Annual measure of the local-road maintenance backlog in England and Wales - the road condition context in which UK tyres actually operate.
Open sourceThe Little Book of Profiling: Basic Information about Measuring and Interpreting Road Profiles
Sayers, M. W. and Karamihas, S. M. (1998). University of Michigan Transportation Research Institute.
Standard reference for road roughness measurement (IRI), the basis for relating surface condition to vehicle dynamic response.
Open source
Non-exhaust particulate emissions
Non-exhaust Traffic Related Emissions - Brake and Tyre Wear PM (EUR 26648 EN)
Grigoratos, T. and Martini, G. (2014). European Commission Joint Research Centre.
Peer-reviewed synthesis of tyre-wear particulate emission factors and the vehicle and operating variables that drive them.
Open sourceNon-exhaust Particulate Emissions from Road Transport: An Ignored Environmental Policy Challenge
Organisation for Economic Co-operation and Development (2020). OECD Publishing, Paris.
Non-exhaust particles, including tyre wear, are becoming the dominant traffic PM source, and heavier electrified vehicles increase wear emissions.
Open sourcePhysical and chemical characterization of tire-related particles
Kreider, M. L., Panko, J. M., McAtee, B. L., Sweet, L. I. and Finley, B. L. (2010). Science of the Total Environment, 408(3), 652-659.
Characterises real-world tyre and road wear particles, confirming that wear rate directly governs particulate release.
Open source
Standards and type-approval framework
UN Regulation No. 64 - Temporary-use spare units, run-flat tyres and tyre pressure monitoring systems
United Nations Economic Commission for Europe (2016). UNECE World Forum for Harmonization of Vehicle Regulations.
The type-approval basis for TPMS in Europe, including the 20% under-inflation warning threshold that AiR treats as a floor, not a target.
Open sourceUN Regulation No. 117 - Tyre rolling sound emissions, wet grip and rolling resistance
United Nations Economic Commission for Europe (2016). UNECE.
Defines the measurement conditions - including reference inflation pressure - for wet grip and rolling-resistance ratings.
Open sourceRegulation (EU) 2020/740 on the labelling of tyres with respect to fuel efficiency and other parameters
European Union (2020). Official Journal of the European Union.
The legal tyre-label framework; label performance is only delivered at the specified inflation pressure.
Open sourceETRTO Standards Manual - load capacity and inflation pressure tables
European Tyre and Rim Technical Organisation (2025). ETRTO, Brussels, annual edition.
The authoritative load/pressure tables. AiR only ever selects a pressure that already exists in an approved table for that vehicle and load.
Open sourceISO 28580: Passenger car, truck and bus tyre rolling resistance measurement method
International Organization for Standardization (2018). ISO.
The single-point rolling-resistance test method referenced by regulators, and the pressure conditions it mandates.
Open source
Official statistics and national surveys
Reported road casualties in Great Britain (annual statistics)
UK Department for Transport (2025). DfT official statistics.
Source of the killed-or-seriously-injured counts attributed to illegal, defective or under-inflated tyres.
Open sourceStagnant road safety, surging tyre defects: analysis of the latest DfT casualty and collision figures
TyreSafe (2026). TyreSafe.
Tyre-related KSI trend, MOT tyre failure volumes, and the call for tyre condition to become a national safety indicator.
Open sourceDriving under pressure is costing the nation's motorists at least GBP 112 million every year in lost tyres
The Motor Ombudsman (2024). The Motor Ombudsman research study.
57% of UK cars run 10% or more below the recommended pressure, and 37% of drivers are not confident inflating their own tyres.
Open sourceWhere are tyres made? UK tyre supply volumes
British Tyre Manufacturers' Association (2025). BTMA.
Approximately 50 million new tyres are supplied into the UK each year across cars, vans, trucks and buses.
Open sourceQuarterly Statistics Update, Q4 2025
Tyres Europe (formerly ETRMA) (2026). Tyres Europe.
European replacement tyre volumes, the market backdrop for a forecourt-scale pressure intervention.
Open source
Tyre warranty terms, exclusions and inspection practice
Passenger and Light Truck Tire Limited Warranty
Michelin North America (2024). Michelin.
A published manufacturer warranty covering workmanship and materials, with pro-rata treatment and explicit exclusion of damage from improper inflation, overloading and misapplication.
Open sourceLimited Warranty and Owner's Manual for Passenger and Light Truck Tires
Bridgestone Americas Tire Operations (2024). Bridgestone.
Shows the standard structure of treadwear mileage guarantees and the maintenance conditions, including correct inflation, on which they depend.
Open sourcePassenger and Light Truck Tire Limited Warranty
Continental Tire the Americas (2024). Continental.
Documents the exclusions that neutralise most irregular-wear claims: under-inflation, over-inflation, misalignment and failure to rotate.
Open sourceHighway Auto and Light Truck Tire Limited Warranty
The Goodyear Tire & Rubber Company (2024). Goodyear.
A mileage warranty conditioned on documented maintenance, establishing that proof of care is already the deciding factor in a claim.
Open sourcePuncture Repair Guidelines and Tire Condition Guidance
U.S. Tire Manufacturers Association (2023). USTMA.
Industry guidance on repairable and non-repairable damage, including sidewall injury and exposed belt or body cord, which sets the boundary of any structural claim.
Open sourceMOT Inspection Manual, section 5.2: Tyres
Driver and Vehicle Standards Agency (2025). UK Government.
The statutory inspection criteria: tread depth, cuts, bulges and exposed ply or cord are failures, while inflation pressure on the day is not assessed at all.
Open source
40 published sources. Peer-reviewed papers, reference monographs, government reports, international standards and official statistics. None of the figures on this page are simulated.
Everything above this point is published third-party research. The panels below use simulated real-world data for demonstration purposes.
Peer-reviewed foundations
Rolling resistance, wear and grip relationships from published research.
The physics
Pressure is a load calculation wearing a number
A placard pressure is not a property of the tyre. It is the answer to a question about mass, speed and duty - which is why the same car needs different numbers on the school run and on a loaded motorway trip.
Pressure change per 10 degrees F
0 PSI
Gay-Lussac's law applied to a fixed-volume tyre.
TPMS warning threshold
0%
Below placard - long after wear and efficiency losses begin.
Typical laden uplift
0 PSI
Rear axle, family vehicle at full occupancy with luggage.
Extra wet stopping distance on worn tread
0 m
At 70mph, published Halfords and Cardiff University CAIR testing.
Adding four adults and luggage to a family car can move well over 300kg onto the vehicle, most of it behind the front axle. The tyre carries that load on air, not rubber, so the required pressure rises with it.
Manufacturers publish this as discrete columns rather than a curve. AiR's job is to pick the right column honestly, not to interpolate a number nobody has approved.
Rear axle load share as occupancy rises
Questions